Introduction
If you want to succeed in trading, one skill matters more than anything else:
Understanding charts and indicators
Many beginners enter trades based on guesswork or tips — but professional traders rely on technical analysis using charts and indicators.
The good news?
You don’t need to be an expert to start. With the right guidance and a simple platform like Marketbhai, you can learn chart reading step by step.
What are Trading Charts?
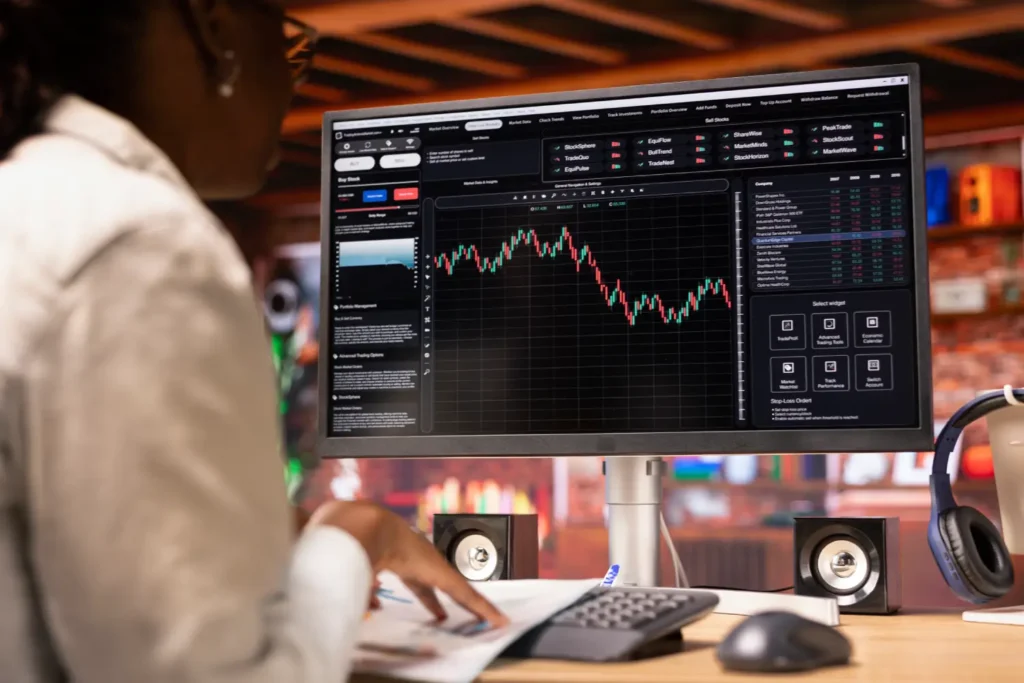
Trading charts are visual representations of price movements over time. They help traders understand:
- Market trends
- Price patterns
- Entry and exit points
Types of Charts:
1. Line Chart
- Simple and easy
- Shows closing prices
2. Bar Chart
- Shows open, high, low, close
3. Candlestick Chart (Most Popular)
- Easy to read
- Shows market sentiment
Marketbhai provides clean and easy-to-read charts for beginners.
Understanding Candlestick Charts
Candlestick charts are the most powerful tool for traders.
Each candle shows:
- Open price
- Close price
- High price
- Low price
Basic Patterns:
- Green Candle: Price goes up
- Red Candle: Price goes down
On Marketbhai, candlestick charts are simple and beginner-friendly.
What are Indicators?
Indicators are tools that help you analyze the market and predict future movements.
They are based on price, volume, and trends.
Marketbhai offers all essential indicators to help you trade smartly.
Top Indicators Every Beginner Should Use
1. Moving Average (MA)
What it does:
Shows the average price over a period.
How to use:
- Price above MA → Uptrend
- Price below MA → Downtrend
Easy to apply on Marketbhai charts.
2. RSI (Relative Strength Index)
What it does:
Measures whether a stock is overbought or oversold.
Levels:
- Above 70 → Overbought (sell signal)
- Below 30 → Oversold (buy signal)
Available on Marketbhai for quick analysis.
3. Volume Indicator
What it does:
Shows how many shares are being traded.
Why important:
- High volume = strong movement
- Low volume = weak movement
Helps confirm trades on Marketbhai.
4. MACD (Moving Average Convergence Divergence)
What it does:
Shows trend direction and momentum.
Signal:
- Bullish crossover → Buy
- Bearish crossover → Sell
Easy to use with Marketbhai tools.
How to Combine Charts & Indicators
Professional traders don’t rely on just one indicator.
Simple Strategy:
- Identify trend using Moving Average
- Confirm with RSI
- Check volume for strength
- Enter trade
This strategy works smoothly on Marketbhai.
Best Timeframes for Beginners
- Intraday Trading: 5-min or 15-min charts
- Swing Trading: 1-hour or daily charts
Switch timeframes easily on Marketbhai platform.
Common Mistakes to Avoid
- Using too many indicators
- Ignoring price action
- Trading without confirmation
- Blindly following signals
Keep it simple — Marketbhai makes analysis easy without confusion.

Pro Tips to Trade Like a Professional
- Focus on 2–3 indicators only
- Always follow the trend
- Use stop-loss
- Practice regularly
- Stay disciplined
With Marketbhai, you can apply these tips effectively.
Why Marketbhai is Perfect for Chart Analysis
Here’s why traders prefer Marketbhai:
- Clean and simple chart interface
- All major indicators available
- Fast and smooth performance
- Beginner-friendly design
- Real-time data
Whether you are a beginner or advanced trader, Marketbhai helps you analyze like a pro.
Final Thoughts
Learning charts and indicators is the foundation of successful trading.
Remember:
- Charts show the story of the market
- Indicators help confirm decisions
- Strategy + discipline = success
Start simple, practice daily, and improve step by step.
With the help of Marketbhai, you can turn complex chart analysis into a simple and powerful skill.
FAQs
1. Which chart is best for beginners?
Candlestick charts are the best and most widely used.
2. How many indicators should I use?
2–3 indicators are enough for beginners.
3. Is Marketbhai good for chart analysis?
Yes, Marketbhai provides easy-to-use charts and indicators.
4. Can I learn trading charts easily?
Yes, with practice and the right platform like Marketbhai, anyone can learn.